 |
www.eclipse-chasers.com Analysis of Five Millennium Canon Author: Jens Buus Last update: 3 JUL 2014 BK |
Eclipse-Chasers Menu Past eclipses Future eclipses |
Analysis of the Five Millennium Canon of Solar Eclipses
- by Jens Buus
Jens Buus has been working with the data provded by the Five Millennium Canon of Solar Eclipses provided by NASA to find interesting information about total solar eclipses. What follows are some of his results.Scatter Plot of Gamma vrs Magnitude for Annular Solar Eclipses
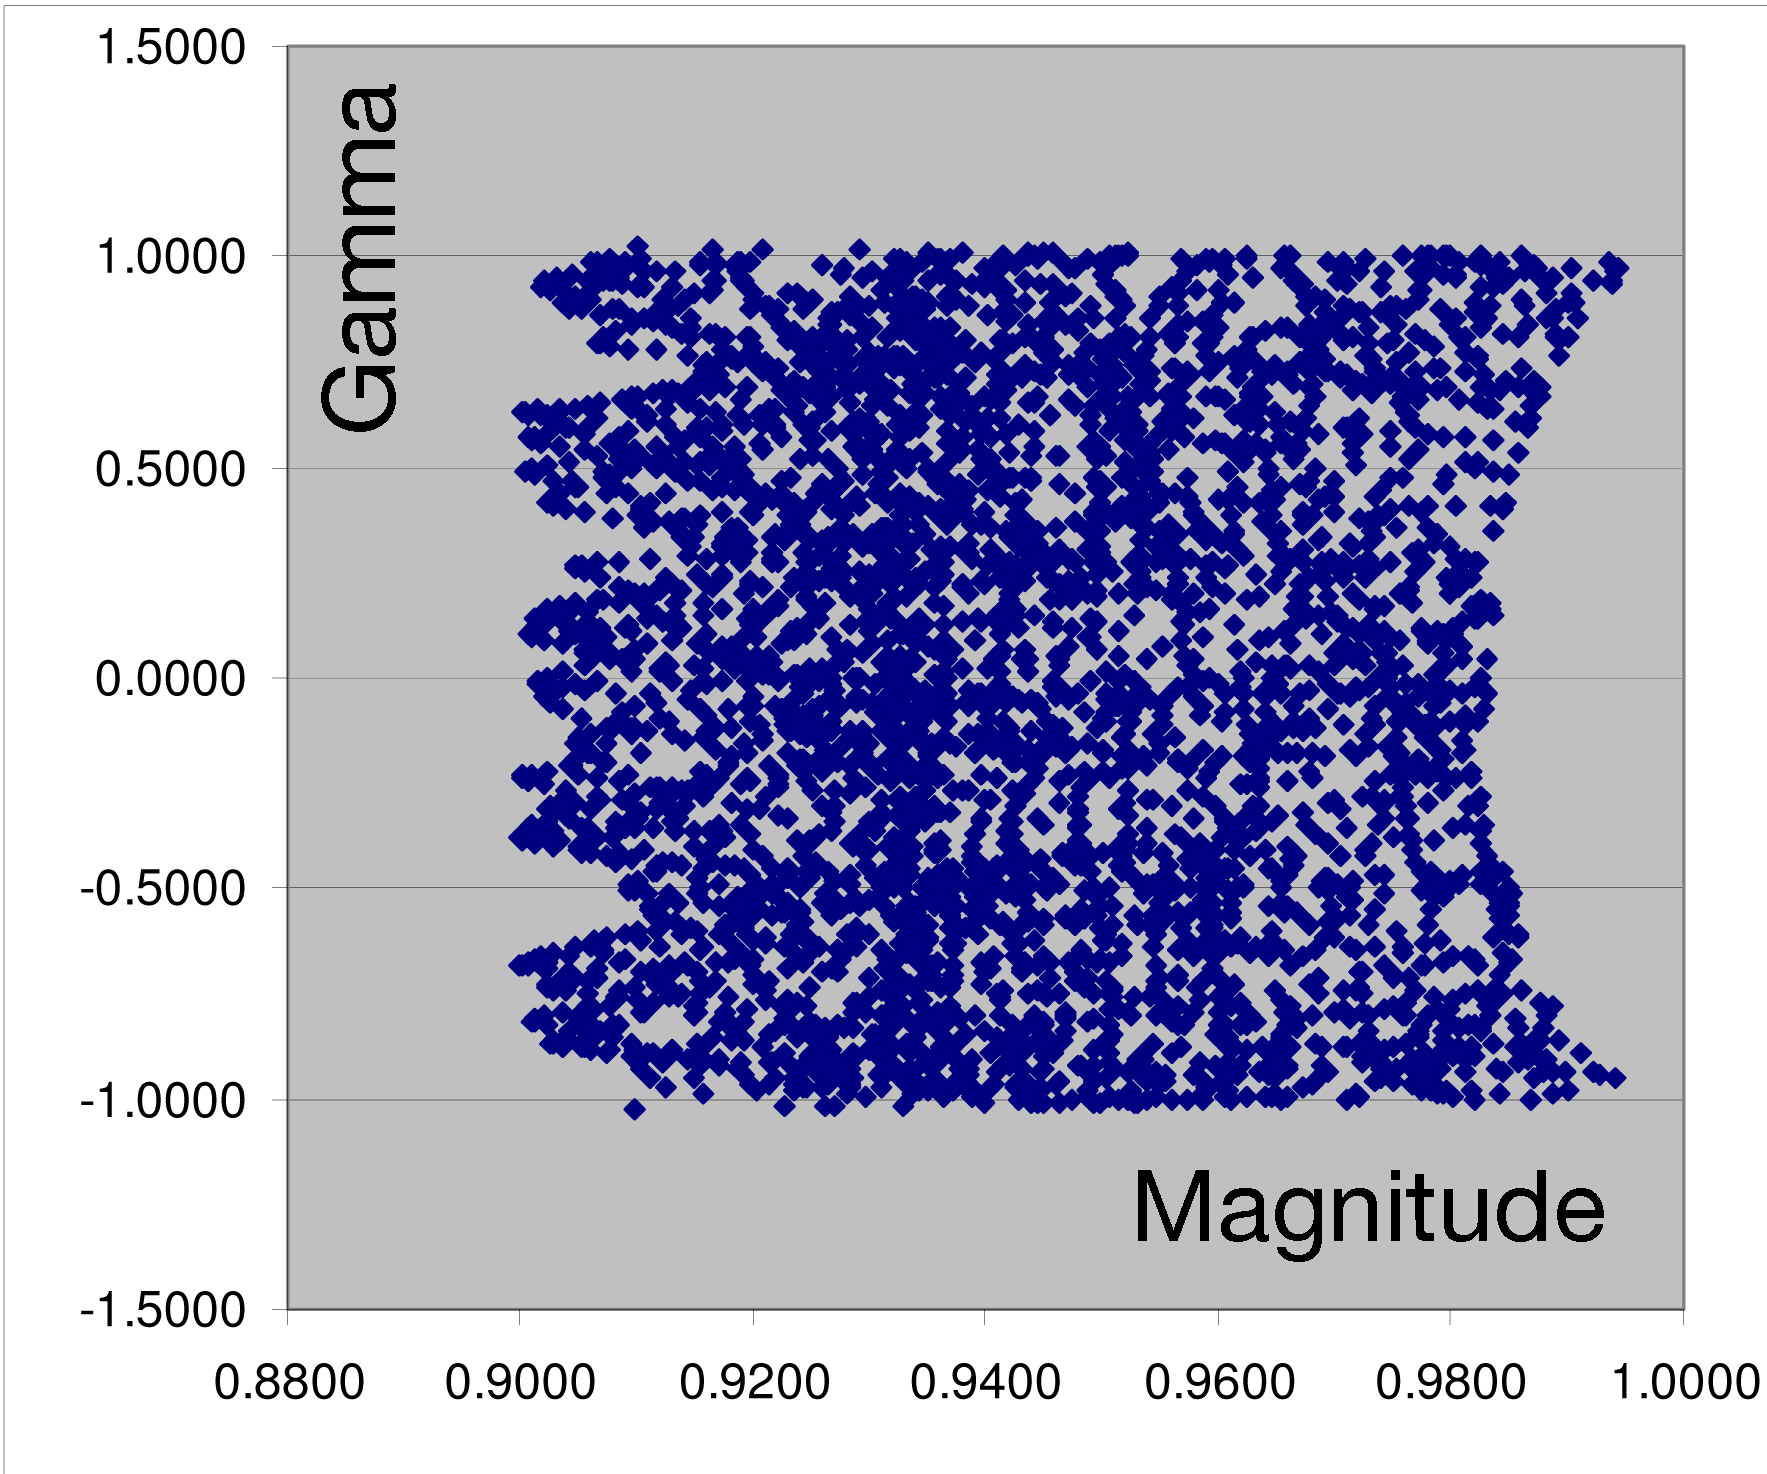 Scatter plot of gamma vs magnitude for the annular eclipses in the Five Millennium Canon. Only “pure” annulars are included, not annular-totals.
More intriguingly, there seems to be some nearly periodic gaps for low magnitudes on the left hand side, so far no explanation has been found for this feature. Actually it almost looks as if there are two overlapping periodicities. A similar plot for total eclipses with large magnitudes does not show this feature.
NOTE: What I call "magnitude" is NOT the magnitude value (M) from the Canon, but a modified magnitude (M') referring to the fundamental plane. These two quantities are related by M'=M-A/B*SQRT(1-gamma^2), with A being the radius of the Earth and B being the (mean) distance of the Moon. This is actually the same kind of operation as appears in eq 9 of my latitude paper (see below). In the language of this paper we have M' = M_0 + M_1 = M(theta,phi) - M_2. Doing a scatter plot with M instead of M' still shows the gaps, but the right hand side is straight.
There is another curious phenomenon: The gaps (on the left hand side) for positive and negative gamma values seem almost "anticorrelated"; compare for example the region of gamma=0.5 with the region of gamma=-0.5. Indeed, if a similar plot is made using the absolute value of gamma (i.e. folding the plot along gamma=0), the gaps vanish!
Maximum Duration as a function of latitude
It is well known that the maximum duration of a total solar eclipse (in the current epoch) is about 7m32s, and it is obvious that the longest duration will occur when the Earth is near aphelion, that this will happen slightly north of equator, and that the maximum duration near the Poles will be shorter. However, the more general question: "What is the maximum duration of a total solar eclipse as a function of the latitude?" does not appear to have been addressed. With assistance from Jean Meeus I have set up and investigated a highly simplified model to provide an approximate result. The math involved consists of only a few trigonometrical expressions, and the numerical work is easily done in a spreadsheet.